Monday, January 18, 2010

Know your ballot

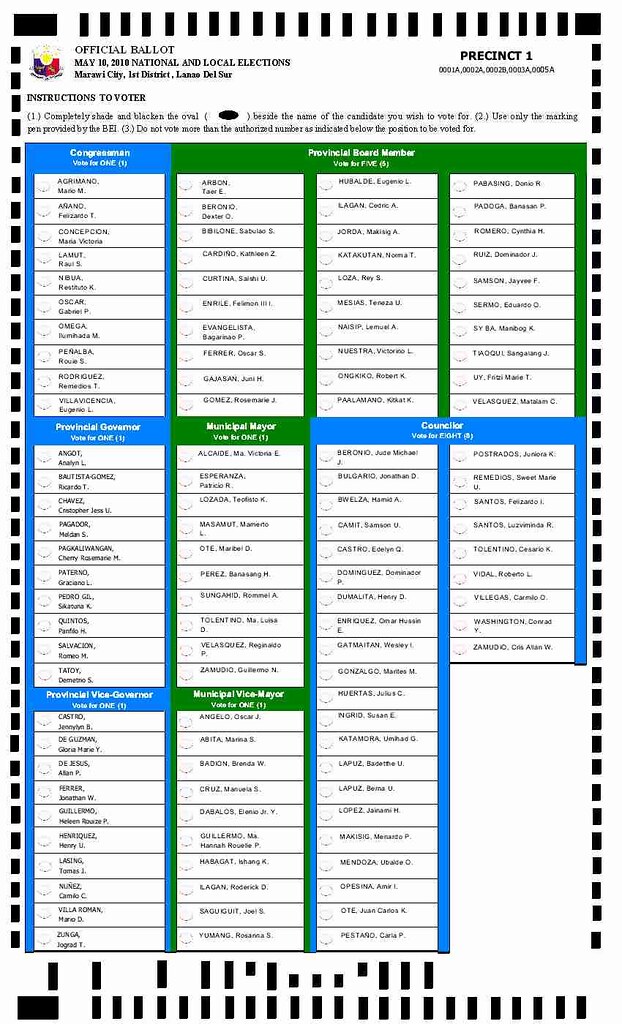
Ballot-FrontI was invited to attend the Bagong Botante event last November 13 together with other bloggers. This was an event I was itching to go to because I wanted to see with my own eyes the counting machine and the ballot to be used in the coming 2010 elections. Yes, I had a lot of questions.
COMELEC and Smartmatic people came out in full force. Among those in the crowd were COMELEC spokesperson James Jimenez, Cesar Flores (President, Smartmatic-Asia Pacific Region), Rafael Cuenca (Smartmatic Voter Education Website Coordinator), Gene Gregorio (Smartmatic Spokesman & PR Manager) and Miguel Avila (also with Smartmatic).
If you’re one of those voting for the first time and you're wondering whether voting is going to be complicated, or if you have some skepticism about the ballot’s being secure, I’ll let you in on some of the things I learned about the ballot that night.
What the Ballot Looks Like
The ballot is still in paper form just like the old ballot we are used to. But it now looks more professional and is roughly the size of an A4 sheet of paper. The names of the candidates running for national positions are printed back-to-back. Here is a sample of the ballot.
Ballot-Front
(Ballot - Front - Click to enlarge)
BallotBack
(Ballot - Back - Click to enlarge)
How To Fill out the Ballot
It’s a lot easier to fill out the ballot now because there is no need to write names. All we have to do is shade the oval beside our candidate of choice.
We also do not need to bring pencils or ballpens. COMELEC-provided markers will be available at the precincts.
To vote, just shade the oval completely right beside the name of your selected candidate. It’s just like coloring the oval. Simple.

Important Do’s and Don’ts
There are a few things to remember so as not to invalidate your vote and to minimize inconveniences to you.

  1. Shade the oval completely. Marking it with a dot, X, a line or any other mark is NOT VALID. Partial shading also may risk invalidation as it won’t be properly read by the machine.
    Marking_Ovals
    Improper_Markings

  2. Do not OVERVOTE. This means you should NOT vote more candidates than available positions. For example, there should be only ONE Presidential vote. If you shaded 2 or more names, your vote for President is invalidated. (Note: only the section with overvoting is invalidated. The other parts of your ballot remain valid as long as you shaded the right number of candidate names for the position).

  3. You can UNDERVOTE. This means you can vote for LESS candidates than available positions. For example, if you need to choose 12 senators but you only opt to vote for 10, that is allowed.

  4. It is better to go to the precinct with your list of chosen candidates already (codigo). This will speed up the time it will take for you to fill up your ballot and reduce chances of mistakes.
Casting Your Vote
You will cast your own vote. It’s simple. Just hold the ballot in your hand and feed it into the machine vertically. Just imagine that it’s just like inserting an ATM card into the machine or feeding paper into a fax machine.
It does not matter whether you feed it in top first or bottom first. Or back on top, or front on top. However way you put it in, the counting machine takes a snapshot of both the top and bottom sides so you are sure your ballot has a captured image (front and back).
Security Features of the Ballot
This was one area I was concerned about so it was interesting to discover that:
  1. Position identifiers on the left and right sides of the ballot help locate the ovals for proper counting and evaluation.
PositionIdentifiers
(Click to enlarge)
  1. Each ballot has a unique bar code. Once the machine reads a ballot’s bar code, any attempt to insert a duplicate ballot with the same code will be rejected.
Bar_Code
(Click to enlarge)
  1. Each ballot is marked with UV ink which is not readily discernible. The counting machine looks first for this mark before it counts a vote. This dispels the possibility of photocopied ballots which obviously won’t have the UV ink mark.
  2. The ballot contains security markings (i.e., watermarks).
Two videos, Quick Guide to the Automated Elections and 2010 Election Voting Machine Info can be viewed HERE.


As of now, while many of my questions about the counting machine and ballots were answered at the event, I am still uneasy about the adequacy of the remaining time left before the May elections for everything to be put in place.
Finding enough IT personnel to man ALL the precincts, training the teachers on the operational procedures, delivering the machines/ballots/indelible ink/markers/etc to all the precincts in time – all these are just some of the things still in my head.
I am hoping though that these will be satisfactorily answered in the coming weeks so that we are all reassured that come election day, there will be no snafus like the confusion and inefficiencies that many people experienced during the recent voter registration.

You might also want to read on How to Vote in an Automated Election.

Thursday, January 14, 2010

How to vote in an Automated Election


Screen capture from Yahoo SEA video.
Read this first: Know your ballot
Know the Automated Election Machine and the Source Code.
New and old voters might be a little intimidated by the fancy technology used for the 2010 Presidential elections. However, the new automated process is being employed for quick, easy, and transparent counting that should minimize fraud. Hopefully, this quick guide on how to vote in an automated election will make the procedure less confusing for you. Before reading the rest of the article, take time to  know your ballot and Know the Automated Election Machine and How to find online your precint before election day.
Step 1- Go to your precinct on May 10
There will be about 37,062 voting centers and 74,427 clustered precincts. Each clustered precinct will have one Precinct Count Optical Scan (PCOS) machine, each of which can supposedly accommodate up to 1,000 voters. Read on How to find online your precint before election day.
Upon arriving at the precinct, a voter should look for his or her name at the Posted Computerized Voters List (PCVL) near the door of the voting center to determine his or her precinct number and sequence number. The voter will be instructed to give these pieces of information to the Bureau of Election Inspector (BEI) together with other personal information.
Make sure you bring your voter’s ID with you. If you don’t have one yet, bring any valid ID along with your registration stub.


how-to-vote-landscape
STEP 2- Get your identity verified
After his or her identity is verified, the name of the voter will be read out loud to give chance for any contention. If uncontested, he or she will be given a ballot by the BEI chairman – only upon ensuring that the said voter has yet to cast his or her vote in another precinct.


STEP 3- How to use your ballot
Take a look on how the ballot looks like first..ballot-sample

Listen to the BEI's instruction on how to fill the ballot. The voter will be instructed to fill out his or her ballot using a secrecy folder and a marking pen provided by the Comelec. He or she must fill out the ballot by fully shading at least 50 percent of the oval beside the names of the candidates and party-list group of his or her choice. View sample ballot
  1. Every voter gets only ONE ballot. No replacement ballots will be given to voters who make a mistake.
  2. Make sure the ballot you receive has no marks and is otherwise clean.
  3. Each ballot comes with the name of the candidates. To the left of the candidates are ovals. Simply shade the oval next to the name of the chosen candidate.
  4. The oval must be shaded COMPLETELY. Ballots with check marks, x marks, partially shaded ovals, and other marks will be regected.
  5. Do not over-vote (e.g. vote two candidates for the position of President) because this will invalidate your votes for the position (but not the whole ballot).
  6. You can bring a sheet of your chosen candidates with you when you vote.
Comelec devised a way to make the ballots easier to read (see sample above)
The ballot will be divided into sections that will be delineated by a colored border. The sections will be colored blue for president, vice president, congressmen, provincial governor, and councilors; and green for senators, party-list groups, provincial board members, and municipal mayors.
STEP 4- Feed your ballot to the PCOS
Get to Know the Automated Election Machine
PCOS stands for Precinct Count Optical Scan. This is a paper-based technology that contains pre-programmed information on the location, number of voters, etc. Each precinct will have one PCOS. Voters themselves feed their ballot into the machine. The machine will scan both sides of the ballot and will reject invalid ballots that are fake, photocopied, or have been previously inserted.
Once you have accomplished your ballot, feed the ballot into the PCOS. Every voter must personally feed his or her ballot into the machine. Wait for the confirmation message to appear on the screen.
Wait until the ballot is dropped into the semi-transparent ballot box. If the ballot is rejected, the BEI will allow for another re-entry, but if rejected again, the voter will not be issued a replacement ballot.
the voter should return the secrecy folder and marking pen to the BEI chairman.
STEP 5 Go to the BEI for indelible inking
The BEI chairman will in turn apply indelible ink at the base and extend it to the cuticle of the right forefinger nail of the voter, who will then be instructed to affix his or her thumbmark in the space in the Election Day Computerized Voters List (EDCVL).
Just familiarize yourself with the steps and by viewing the video so you have an idea on how the process is like.
Help keep Philippine Elections clean
Philippine elections are characterized by vote-buying, intimidation, coercion, and terrorism. With many voters casting ballots with illegible handwriting and a procedure with weak security, it's easy to tamper election results and commit fraud. Hopefully the new automated system will eliminate all of these. It also helps if voters remain vigilant, cooperative, and coordinated during Election Day. Vote wisely. Choose your candidate based on coherent platform, character and competency.

Few Filipinos know little of automated polls

Even as 61 percent of Filipinos know little about the automated election system, almost half (49 percent) believe that there will be much trouble in the country if the May 10, 2010 elections will not push through, according to an independent survey.

These are two of the conclusions of a nationwide survey conducted by Pulse Asia between October 22 and 30 among 1,800 respondents with a margin of error of plus or minus 2 percent.

Despite this ignorance of the new way of voting, 40 percent think that automating the counting of the votes will result in clean elections with credible results. Only 16 percent believe otherwise. The rest (43 percent) are undecided about the effects of poll automation.

At the same time, it said: “The prevailing sentiment among Filipinos is that it is highly likely that the May 2010 polls will be held as scheduled [67 percent].”

The same survey concluded that 64 percent of Filipinos believe that the country’s public school teachers will perform their duties as members of the board of election inspectors, with 65 percent believing that the same teachers are capable of managing the automated polls this year.

Thursday, November 12, 2009

Globe Tattoo Hack


Here’s an update for the Globe Tattoo Hack or might as well we can call it a Globe Tattoo Tweak since it deals with tweaking your Globe Tattoo USB Stick to perform at its utmost performance.
Here is what I do to tweak and/or hack my Globe tattoo.
  • Insert you Globe Tattoo to your PC / Laptop and let the Globe Tattoo Interface initiate. Once initiated, make sure that your Globe Tattoo is not connected yet, and then go to Tools then choose Options.

.
  • Once your inside the Options window, choose Profile Management and choose “New” and you’ll get to the window below.
  • Under the Profile Name, you can opt to choose any kind of name you want for that connection.
  • Under the APN box, choose the Static Option and enter http.globe.com.ph on the APN Field
  • Under the Authentication Box put *99***1# on the access number box. There is no need to input anything on the username and password fields.

.
  • after setting everything up, click the advanced button and change the DNS Settings to “static” type your preferred DNS in the fields. Click here for a list of Globe DNS values applicable for Globe Internet.

.
  • After that, click Ok and then click Save on the right panel. Also don’t forget to set it as default. Once you go back to the Globe Tattoo interface, the new Globe Tattoo Network Profile would now be available on the dropdown menu.
You can now choose it and use it when connecting your Globe Tattoo to the internet. I named mine Special DNS like the one below.

So that’s it, that is how my Globe Tattoo Hack Tweak, if you know any other tweaks then you can share using the comment feild below.
Note though, this works for me but I cannot guarantee that it would work for you… Dont intend to do this if you are going to complain to me if it does not work. Do the Globe Tattoo Hack – Tweak at your own risk.


Wednesday, November 11, 2009

The Sangguniang Kabataan (Sk)

The Sangguniang Kabataan or SK (Youth Council) is the governing body in every chapter of the Katipunan ng Kabataan (Youth Federation). Each barangay in the Philippines is mandated by law to have its own chapter of the Katipunan ng Kabataan in which the members elect their officers called as the Sangguniang Kabataan. The Sangguniang Kabataan is an off-shoot of the KB or the Kabataang Barangay (Village Youth) which was abolished when the Local Government Code of 1991 was enacted.

The Sangguniang Kabataan is the youth legislature in every local village or community. It also initiates policies, programs and projects for the development of youth in their respective political territories. The Chairman of the Sangguniang Kabataan acts as the Chief Executive of the Sanggunian (Council) while the Kagawad (Councilor) as the legislative council. The Kagawads approve resolutions of the Sanggunian and appropriates the money allotted to the council, a share in the revenue of the Barangay.

The Chairman automatically sits in the Sanggunian Barangay (Village Council) as ex-officio member. He automatically gets chairmanship of the Committee on Youth and Sports, one of the standing committees in the village council. Every Sangguniang Kabataan is then federated into municipal and city federations, then city and municipal federations are federated into a provincial federation.

The barangay SK Chairman represents the barangay in the municipal or city federation. The presidents of the city and municipal federation presidents becomes member of the provincial federation and the provincial federation president becomes member of the national federation. The presidents of highly urbanized and independent component cities completes the membership in the national federation. The entire membership in the Federation elect the national federation president who automatically sits in the National Youth Commission as ex-officio member.

The national federation is governed by the National Executive Board while the municipal, city to provincial federation is governed by the Local Executive Committee composed mostly of the seven regularly elected officers of the federation.

Since 1992 up to the present, there have been three simultaneous nationwide SK elections held in the Philippines which each term lasting from a minimum of three to five years due to amendment of the regular 3-year term limit of the council. After every poll, election of federation officers follows. The elected presidents in the municipal and city federations sit as ex-officio member in the municipal or city council respectively while the provincial president represent the youth in the provincial board. All of these ex-officio members automatically chair the council's committee on youth and sports development.


What is Barangay?


The barangay is the basic political unit in the Philippines. It serves as the primary planning and implementing unit of government policies, plans, programs, projects, and activities in the community, and as a forum wherein the collective views of the people may be expressed, crystallized and considered, and where disputes may be amicably settled.

A barangay may be created out of a contiguous territory which has a population of at least 2,000, except in cities and municipalities within Metro Manila and other metropolitan political subdivisions or in highly urbanized cities where such territory shall have a certified population of at least 5,000. To enhance the delivery of basic services in the indigenous cultural communities, Congress may create a barangay in these communities.

Every barangay has a punong barangay, seven Sangguniang Barangay members, the Sangguniang Kabataan chairperson, a barangay secretary, and a barangay treasurer.

The Sangguniang Barangay, the legislative body of the barangay, is composed of the punong barangay as presiding officer, and the seven regular Sangguniang Barangay members elected at large and Sangguniang Kabataan chairperson as members.

A barangay also has a Lupong Tagapamayapa, which consists of 10 to 20 members and exercises administrative supervision over conciliation panels to effect speedy resolution of disputes.

Who may be elected punong barangay or member of the sangguniang barangay?

  • A citizen of the Philippines
  • At least 18 years old on election day
  • A registered voter and a resident for at least one year immediately before election in the barangay where he or she is running
  • Able to read and write Filipino or any other local language or dialect

What happens if a permanent vacancy occurs in the office of the punong barangay?

  • The highest ranking sangguniang barangay member or, in case of his or her permanent inability, becomes the punong barangay.
  • A tie between or among the highest ranking sanggunian members will be resolved by the drawing of lots.
  • The successor will serve the unexpired term of his or her predecessor.

What a punong barangay can do

  • Enforce all laws and ordinances applicable within the barangay
  • Negotiate, enter into, and sign contracts for and in behalf of the Barangay, upon authorization of the Sangguniang Barangay
  • Maintain public order in the barangay and assist the city or municipal mayor and the sanggunian members in the performance of their duties and functions
  • Call and preside over the sessions of the Sangguniang Barangay and the Barangay assembly, and vote only to break a tie
  • Upon approval by a majority of all the members of the Sangguniang Barangay, appoint or replace the barangay treasurer, the barangay secretary, and other appointive barangay officials
  • Organize and lead an emergency group whenever the same may be necessary for the maintenance of peace and order or on occasions of emergency or calamity within the Barangay
  • In coordination with the Barangay development council, prepare the annual executive and supplemental budgets of the barangay
  • Approve vouchers relating to the disbursement of barangay funds
  • Enforce laws and regulations relating to pollution control and protection of the environment
  • Administer the operation of the Katarungang Pambarangay
  • Exercise general supervision over the activities of the Sangguniang Kabataan
  • Ensure the delivery of basic services
  • Conduct an annual palarong barangay which will feature traditional sports and disciplines included in national and international games, in coordination with the Department of Education
  • Promote the general welfare of the barangay
  • Possess and carry the necessary firearm within his territorial jurisdiction, subject to appropriate rules and regulations

What the Sangguniang Barangay can do

  • Enact ordinances necessary to discharge the responsibilities conferred upon it by law or ordinance and to promote the general welfare of inhabitants
  • Enact tax and revenue ordinances, subject to the limitations imposed in the Local Government Code
  • Enact annual and supplemental budgets
  • Provide for the construction and maintenance of barangay facilities and other public works projects chargeable to the general fund of the barangay or such other funds actually available for the purpose
  • Submit to the Sangguniang Panlungsod or Sangguniang Bayan such suggestions or recommendations as it may see fit for the improvement of the barangay or for the welfare of its inhabitants
  • Assist in the establishment, organization, and promotion of cooperative enterprises that will improve the economic condition and well-being of residents
  • Regulate the use of multipurpose halls, multipurpose pavements, grain or copra dryers, patios and other post-harvest facilities, barangay waterworks, barangay markets, parking areas or other similar facilities constructed with government funds within the jurisdiction of the barangay and charge reasonable fees for their use
  • Solicit or accept monies, materials, and voluntary labor for specific public works and cooperative enterprises of the barangay from residents, land owners, producers, and merchants in the Barangay, provided that monies or properties donated by private agencies and individuals for specific purposes shall accrue to the barangay as trust fund
  • Provide compensation, reasonable allowances, or per diems as well as travel expenses for Sangguniang Barangay members and other Barangay officials, subject to budgetary and other limitations
  • Hold fund-raising activities for barangay projects without the need of securing permits from any national or local office or agency, but not within a period of 60 days immediately preceding and after a national or local election, recall, referendum, or plebiscite
  • Authorize the punong barangay to enter into contracts on behalf of the barangay
  • Authorize the barangay treasurer to make direct purchases in an amount not exceeding P1,000 at any one time for the ordinary and essential administrative needs of the barangay
  • Prescribe fines in amounts not exceeding P1,000 for violation of barangay ordinances

What disputes can be brought to the Lupong Tagapamayapa for amicable settlement?
The Lupong Tagapamayapa of each barangay has authority to bring together the parties actually residing in the same city or municipality for amicable settlement of all disputes except:

  • Where one party is the government, or any subdivision or instrumentality thereof
  • Where one party is a public officer or employee, and the dispute relates to the performance of his official functions
  • Offenses punishable by imprisonment exceeding one year or a fine exceeding P5,000
  • Offenses where there is no private offended party
  • Where the dispute involves real properties located in different cities or municipalities unless the parties thereto agree to submit their differences to amicable settlement by an appropriate lupon
  • Disputes involving parties who actually reside in barangays of different cities or municipalities, except where such barangay units adjoin each other and the parties thereto agree to submit their differences to amicable settlement by an appropriate lupon

Sangguniang Kabataan
The Sangguniang Kabataan is composed of a chairperson, seven members, a secretary, and a treasurer.

Who may be elected to the Sangguniang Kabataan?

  • A citizen of the Philippines
  • At least 15 years but not more than 21 years of age on election day
  • A qualified voter of the katipunan ng kabataan (The katipunan ng kabataan is composed of all citizens of the Philippines actually residing in a barangay for at least six months, who are 15 but not more than 21 years of age, and who are duly registered in the list of the Sangguniang Kabataan or in the official barangay list in the custody of the barangay secretary)
  • A resident of the barangay for at least one year immediately before election
  • " Able to read and write Filipino, English, or the local dialect


What happens if a permanent vacancy occurs in the Sangguniang Kabataan?

  • A Sangguniang Kabataan official who, during his or her term of office, passes the age of 21 years is allowed to serve the remaining portion of the term for which he or she was elected.
  • In case a Sangguniang Kabataan chairperson refuses to assume office, fails to qualify, is convicted of a felony, voluntarily resigns, dies, is permanently incapacitated, is removed from office, or has been absent without leave for more than three consecutive months, the Sangguniang Kabataan member who obtained the next highest number of votes in the election immediately preceding will assume the office of the chairperson for the unexpired portion of the term. Where two or more Sangguniang Kabataan members obtained the same next highest number of votes, the other Sangguniang Kabataan members will conduct an election to choose the successor to the chairperson from among the said members.
  • After the vacancy has been filled, the Sangguniang Kabataan chairperson will call a special election to complete the membership of said sanggunian. Such Sangguniang Kabataan member will hold office for the unexpired portion of the term of the vacant seat.

What the Sangguniang Kabataan can do

  • Promulgate resolutions necessary to carry out the objectives of the youth in the barangay
  • Initiate programs designed to enhance the social, political, economic, cultural, intellectual, moral, spiritual, and physical development of the members
  • Hold fund-raising activities, the proceeds of which shall be tax-exempt and shall accrue to the general fund of the Sangguniang Kabataan
  • Create such bodies or committees as it may deem necessary to effectively carry out its programs and activities
  • Consult and coordinate with all youth organizations in the barangay for policy formulation and program implementation
  • Coordinate with the appropriate national agency for the implementation of youth development projects and programs at the national level


HEALTH and HOUSEHOLD STATISTICS

FREQUENCY AND PERCENTAGE DISTRIBUTION AS TO SOURCE OF HEALTH SERVICES


Greater part of the household goes to the hospital as their sources of health services with a frequency of two hundred ninety two (292) and a percentage of thirty four point ninety three percent (34.93%) while the smallest part of the percentage utilize other source of health services with a frequency of two (2) and percentage of zero point four percent (0.4%)

The finding revealed that greater part of the households goes to the hospital as their source of their services.

Frequency and Percentage Distribution as to Source of Health Services

Category

Frequency

Percentage

Hospital

292

34.93%

Health Center

246

29.43%

Private Doctor

175

20.93%

Clinic

48

5.74%

Herbolaryo

44

5.26%

Mananawas

23

2.75%

Manghihilot

6

0.72%

Others

2

0.24%

Total

836

100%

FREQUENCY AND PERCENTAGE DISTRIBUTION AS TO TYPE OF FAMILY

More than half of the household has a nuclear type of family with the frequency of five hundred sixty one (561) and a percentage of sixty eight point seventy five percent (68.75%) while the lowest number of the household have cohabitating type of family with the frequency of seventeen (17) and a percentage of two point zero eight percent (2.08%)

The finding revealed that more than half of the households have nuclear type of family

Frequency and Percentage Distribution as to type of Family

Category

Frequency

Percentage

Nuclear

561

68.75%

Extended

200

24.51%

Single-parent

38

4.66%

Cohabitating

17

2.08%

Total

816

100%

FREQUENCY AND PERCENTAGE DISTRIBUTION AS TO RELIGION

Most of the respondents are catholic with a frequency of four thousand two hundred sixteen (4,216) or ninety two point ninety five percent (92.95%) while the seven point zero five percent (7.05%)

The findings revealed that most of the respondents are catholic

Table: Religion

CATEGORIES

FREQUENCY

PERCENTAGE

Catholic

4,216

92.95%

Non-Catholic

320

7.05%

Total

4,536

100%

FREQUENCY AND PERCENTAGE DISTRIBUTION AS TO MONTHLY INCOME

Greater part of the households are poor with a frequency five hundred sixty three (563) or sixty nine percent (69%) while the smallest part of households are not poor with a frequency of two hundred fifty three (253) or thirty one percent (31%)

The findings revealed that the greater part of the households is poor.

Table: Monthly Income.

CATEGORIES

FREQUENCY

PERCENTAGE

Poor

563

69%

Not Poor

253

31%

Total

816

100%

FREQUENCY AND PERCENTAGE DISTRIBUTION AS TO NUTRITIONAL STATUS (CHILDREN 0-60 MONTHS)

More than half of the children aging zero (0) to sixty (60) months were malnourished with a frequency of two hundred seventy nine (279) and a percentage of fifty point zero nine (50.09%) while the fewest number of children were over nourished with a frequency of twenty five (25) and a percentage of four point forty-nine percent (4.49%).

The findings revealed that more than half of the children aging zero (0) to sixty (60) months were malnourished.

Frequency and Percentage Distribution as to Nutritional Status (0-60 months)

CATEGORIES

FREQUENCY

PERCENTAGE

Malnourished

279

50.09%

Nourished

253

45.42%

Over Nourished

25

4.49%

Total

557

100%

FREQUENCY AND PERCENTAGE DISTRIBUTION AS TO IMMUNIZATION STATUS (CHILDREN 0-12 MONTHS)

More that half of the children aging zero (0) to twelve (12) months have complete immunization status with a frequency of seventy five (75) and a percentage of fifty-four point seventy four percent (54.74%) while few numbers of children were not yet immunized with a frequency of ten (10) and a percentage of seven point three percent (7.3%).

The findings revealed that more than half of the children aging zero (0) to twelve (12) months had complete immunization status.

Frequency and Percentage Distribution as to Immunization Status (0-12 months)

Category

Frequency

Percentage

Complete

75

54.74%

Incomplete

52

37.96%

Never been immunized

10

7.3%

Total

137

100%

FREQUENCY AND PERCENTAGE DISTRIBUTION AS TO TYPES OF INFANT FEEDING

More than half of the infants were being bottle fed with a frequency of seventy two (72) and a percentage of fifty two point fifty five percent (52.55%) while the least number of infant were being mixed fed with a frequency of nineteen (19) and percentage of thirteen point eighty seven percent (13.87%) The findings revealed that more than half of the infants are being bottle-fed

Frequency and Percentage distribution as to types of Infant Feeding

Category

Frequency

Percentage

Bottle Feeding

72

52.55%

Breast Feeding

46

33.58%

Mixed Feeding

19

13.87%

Total

137

100%

FREQUENCY AND PERCENTAGE DISTRIBUTION AS TO TYPES OF MILK FORMULA

Out of ninety one (91) children, ninety one (91) or one hundred percent (100) of the children had a powdered type of milk formula.

The findings revealed that all children were given powdered type of milk formula

Frequency and Percentage Distribution as to type of Milk Formula

Categories

Frequency

Percentage

Powdered

91

100%

Total

91

100%

FREQUENCY AND PERCENTAGE DISTRIBUTION AS TO TYPE OF HOUSE STRUCTURE

Most of the households have a concrete type of house structure with a frequency of five hundred twenty five (525) and a percentage of sixty four point thirty four (64.34%) while the least of the respondents have a light type of house structure with a frequency of one (1) and a percentage of zero point twelve percent (0.12%)

The findings revealed that most of the households have a concrete type of house structure.

Frequency and Percentage Distribution as to Type of House Structure

Categories

Frequency

Percentage

Concrete

525

64.34%

Semi-concrete

240

29.41%

Wood

50

6.13%

Light

1

0.12%

Total

816

100%

FREQUENCY AND PERCENTAGE DISTRIBUTION AS TO NATURAL VENTILATION

More than half of the households have adequate natural ventilation with a frequency of five hundred eighty four (584) or seventy one point fifty seven percent (71.57%) while the remaining household have inadequate natural ventilation with a frequency of two hundred thirty two (232) or twenty eight point forty three percent (22.43%).

The findings revealed that majority of the households have adequate natural ventilation.

Table: Natural Ventilation

Categories

Frequency

Percentage

Adequate

584

71.57%

Inadequate

232

28.43%

Total

816

100%

FREQUENCY AND PERCENTAGE DISTRIBUTION AS TO SOURCE OF NATURAL LIGHTING

Majority of the households have adequate source of natural lighting with a frequency of six hundred thirty three (633) or seventy seven point fifty seven percent (77.57%) while the remaining households have inadequate source of natural lighting with a frequency of one hundred eighty three (183) or twenty point forty three percent (22.43%).

The findings revealed that majority of the households have adequate source of natural lighting.

Table: Source of Natural Lighting

Categories

Frequency

Percentage

Adequate

633

77.57%

Inadequate

183

22.43%

Total

816

100%

FREQUENCY AND PERCENTAGE DISTRIBUTION AS TO HYGIENIC STATUS OF TOILET FACILITY

Nearly half of the households have fair toilet facility which constitute to three hundred ninety (399) or forty nine point twenty six percent (49.26%) while seventy (70) of the respondents or eight point sixty four percent (8.64%) have toilet facility when it comes to hygienic status.

The findings revealed that nearly half of the households do have a fair toilet facility in terms of hygienic status.

Frequency and Percentage Distribution as to Hygienic status of Toilet Facility

Category

Frequency

Percentage

Fair

399

49.26%

Good

341

42.1%

Poor

70

8.64%

Total

816

100%

FREQUENCY AND PERCENTAGE DISTRIBUTION AS TO WATER FACILITY

Most of the households have private type of water supply with a frequency of six hundred thirty two (632) or seventy seven point forty five percent (77.45%) while the least of households have public type of water facility with a frequency of ninety (90) or eleven point zero three percent (11.03%).

The findings revealed that most of the households have private type of water supply facility.

Table: Water Supply Facility.

Categories

Frequency

Percentage

Private

632

77345%

Share

94

11.52%

Public

90

11.03%

Total

816

100%

FREQUENCY AND PERCENTAGE DISTRIBUTION AS TO SOURCE OF WATER SUPPLY

Greater number of households utilize their water system as their source of water supply with a frequency of six hundred fifty four (654) or eighty point fifteen percent (80.15%) while few number of households have their jetmatic as their source of water supply with a frequency of eight (8) or zero point ninety eight percent (0.98%).

The findings revealed that majority of households utilize their water system as their source of water supply.

Table: Source of Water Supply

Categories

Frequency

Percentage

Water System

654

80.15%

Pitcher Pump

139

17.03%

Deep Well

15

1.84%

Jetmatic

8

0.98

Total

816

100%

FREQUENCY AND PERCENTAGE DISTRIBUTION AS TO COVERING DRINKING WATER STORAGE

More than half of the households cover their drinking water storage with a frequency of seven hundred seventy five (775) or ninety four point ninety eighty percent (94.98%) while the least of households do not cover their drinking water storage with a frequency of forty one (41) of five point zero two percent (5.02%).

The findings revealed that greater number of households cover their drinking water storage.

Table: Covering Drinking Water Storage.

Categories

Frequency

Percentage

Covered

775

94.98%

Uncovered

41

5.02%

Total

816

100%

FREQUENCY AND PERCENTAGE DISTRIBUTION AS TO METHOD OF GARBAGE DISPOSAL

Majority of the households garbage were collected by a garbage collector with a frequency of seven hundred ten (710) and a percentage of eighty seven point zero one percent (87.01%) while the least number of households use burying as their method of garbage disposal with a frequency of nine (9) and a percentage of one point ten percent (1.10%).

The findings revealed that majority of the households methods of garbage disposal is through collection.

Frequency and Percentage Distribution as to Method of Garbage Disposal

Categories

Frequency

Percentage

Collection

710

87.01%

Dumping

75

9.19%

Burning

22

2.70%

Burying

9

1.10%

Total

816

100%

FREQUENCY AND PERCENTAGE DISTRIBUTION AS TO TYPE OF GARBAGE DISPOSAL

Most of the households dispose their garbage on a sack with a frequency of five hundred forty six (546) and a percentage of sixty six point ninety one percent (66.91%) while the least number of households dispose their garbage in a box with a frequency of four (4) and a percentage of zero point forty nine percent (0.49%).

The findings revealed that majority of the household dispose their garbage in a sack.

Frequency and Percentage Distribution as to type of Garbage Disposal

Categories

Frequency

Percentage

Sack

546

66.91%

Plastic bag

172

21.08%

Container

47

5.76%

Drum

32

3.92%

Can

9

1.10%

Pail

6

0.74%

Box

4

0.49%

Total

816

100%

FREQUENCY AND PERCENTAGE DISTRIBUTION AS TO COVERAGE OF TRASH CONTAINER

Majority of the households cover trash container with a frequency of four hundred thirty three (433) or fifty three point zero six percent (53.06%) while the remaining households uncover trash container with a frequency of three hundred eighty three (383) or forty six point ninety four percent (46.94%).

The findings revealed that majority of households cover their trash container.

Table: Coverage of Trash Containers

Categories

Frequency

Percentage

Covered

433

53.06%

Uncovered

383

46.94%

Total

816

100%

FREQUENCY AND PERCENTAGE DISTRIBUTION AS TO SEWAGE SYSTEM

The biggest number of the households have open sewage system with a frequency of six hundred four (604) or seventy four point zero two percent (74.02%) while the smallest number of households have no sewage system with a frequency of twenty six (26) or three point nineteen percent (3.19%).

The findings revealed that the biggest number of households have open sewage system.

Table: Sewage System

Categories

Frequency

Percentage

Open

604

74.02%

Blind

186

22.79%

None

26

3.19%

Total

816

100%

FREQUENCY AND PERCENTAGE DISTRIBUTION AS TO METHOD OF PEST CONTROL

Almost all of the households use chemical method of pests control with a frequency of five hundred eighty three (583) or seventy one point forty five percent (71.45%) while the remaining households use physical method of pests control with a frequency of two hundred thirty three (233) of twenty eighty point fifty five percent (28.55%).

The findings revealed that almost all of the households use chemical method of pest control.

Table: Method of Pest Control

Categories

Frequency

Percentage

Chemical

583

71.45%

Physical

233

28.55%

Total

816

100%

FREQUENCY AND PERCENTAGE DISTRIBUTION AS TO METHOD OF EXCRETA DISPOSAL

Most of the households use septic tank with or without water carriage with a frequency of eight hundred ten (810) or ninety point twenty six percent (99.26%) while the least of households uses squat method with a frequency of one (1) or zero point twelve percent (0.12%).

The findings revealed that most of the household uses septic tank with or without water carriage.

The findings revealed that most of the household uses septic tank with or without water carriage.

Table: Method of Excreta Disposal

Categories

Frequency

Percentage

Septic Tank with or without Water Carriage

810

99.26%

Wrap or Throw

5

0.16%

Squat Method

1

0.12%

Total

816

100%

FREQUENCY AND PERCENTAGE DISTRIBUTION AS TO FOOD SOURCE

Greater than half of the households buy their food in the market with a frequency six hundred fifty two (652) or seventy nine point ninety percent (79.90%) while the least number of households produce their own food with a frequency of one (1) or zero point twelve percent (0.12%).

The findings revealed that most of the households buy their food in the market.

Table: Food Source

Categories

Frequency

Percentage

Market

652

79.90%

Sari-sari Store

119

14.58%

Ambulant Vendor

44

5.39%

Own Produce

1

0.12%

Total

816

100%

FREQUENCY AND PERCENTAGE DISTRIBUTION AS TO FOOD COVERAGE STATUS

Greater number of households cover their foods regularly with a frequency of seven hundred fifty six (756) or ninety two point sixty five percent (92.65%) while the remaining households leave foods uncovered with a frequency of sixty (60) or seven point thirty five percent (7.35%).

The findings revealed that majority of households cover their foods regularly.

Table: Food Coverage Status

CATEGORIES

FREQUENCY

PERCENTAGE

Covered

756

92.65%

Uncovered

60

7.35%

Total

816

100%

FREQUENCY AND PERCENTAGE DISTRIBUTION AS TO FOOD COVERAGE STATUS

Greater number of households cover their foods regularly with a frequency of seven hundred fifty six (756) of ninety two point sixty five percent (92.65%) while the remaining households leave foods uncovered with a frequency of sixty (60) or seven point thirty five percent (7.35%).

The findings revealed that majority of households cover their foods regularly.

Table: Food Coverage Status

Categories

Frequency

Percentage

Covered

756

92.65%

Uncovered

60

7.35%

Total

816

100%

FREQUENCY AND PERCENTAGE DISTRIBUTION AS TO GENERAL SANITARY CONDITION

Most of the households have fair general sanitary condition with a frequency of four hundred thirty eight (438) of fifty three point sixty eight percent (53.68%) while the least of households have poor general sanitary condition with a frequency of thirty eight (38) or four point sixty six percent (4.66%).

The findings revealed that most of the households have fair general sanitary condition.

Table: General Sanitary Condition.

CATEGORIES

FREQUENCY

PERCENTAGE

Fair

436

53.68%

Good

340

41.67%

Poor

38

4.66%

Total

816

100%


Related Posts Plugin for WordPress, Blogger...